






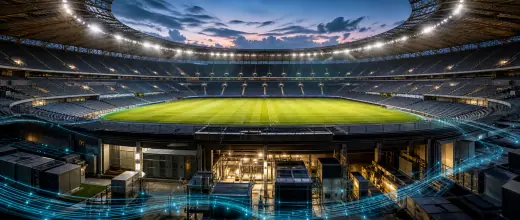
Case study 01 - Luxury hospitality portfolio
Luxury Hospitality Reimagined with Digital Twin Intelligence
See how a connected operational model can improve energy performance while protecting guest comfort across a complex hospitality estate.
Business context
A complex portfolio where comfort and efficiency must coexist.
A luxury hospitality portfolio combines guest rooms, kitchens, leisure facilities, central plant and fluctuating occupancy. Energy decisions must protect premium service while improving operational and financial performance.
- Connected evidence across the estate
- Comfort and service constraints remain explicit
- Every scenario retains its assumptions
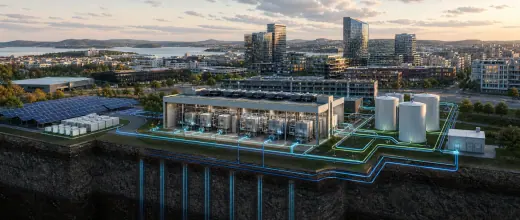
Building the future of sustainable coastal hospitality
Leadership needed a credible way to connect operational performance, investment priorities and sustainability outcomes without compromising service.
Business challenge
Energy cost, carbon and service requirements were managed through fragmented systems and delayed reporting.
Decision requirement
Teams needed to compare interventions, understand assumptions and rank opportunities before committing operational or capital resources.
Business transformation
A shared decision model connects engineering, finance, operations and sustainability around the same evidence.
Property ownersEngineering teamsFinance leadersSustainability teamsOperations
What the Digital Twin must understand
High energy costs
Connect operational behaviour, asset condition and demand context before recommending change.
Guest comfort
Connect operational behaviour, asset condition and demand context before recommending change.
Dynamic occupancy
Connect operational behaviour, asset condition and demand context before recommending change.
Reactive analysis
Connect operational behaviour, asset condition and demand context before recommending change.
Carbon commitments
Connect operational behaviour, asset condition and demand context before recommending change.
Disconnected systems
Connect operational behaviour, asset condition and demand context before recommending change.
What changed operationally
Moving from fragmented reporting to a connected operating model changes how teams identify, test and verify improvements.
Reactive and fragmented
- Monthly utility review
- Disconnected BMS and meter data
- Manual baselines
- Limited scenario comparison
- Delayed maintenance response
- Portfolio performance difficult to compare
ENERGE TWINGoverned decision layer
Connected and predictive
- Live operational evidence
- Normalised performance baselines
- Automated variance detection
- Scenario testing before change
- Ranked investment opportunities
- Continuous outcome verification
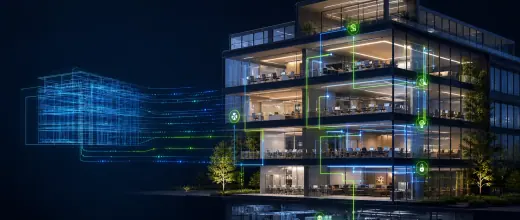
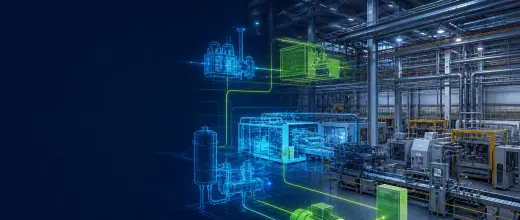
BMS, PMS and enterprise systems become one operational picture
ENERGE TWIN complements the existing estate rather than forcing wholesale replacement.
Connect the controls already operating the estate
BMS, meters, HVAC controls, renewable systems and IoT signals retain their operational roles.
Relate energy demand to how the property is used
Occupancy, bookings, weather, tariffs and maintenance context explain demand.
Unify evidence needed for confident decisions
Measured, derived and modelled data remain distinguishable and auditable.
Integrate without creating uncontrolled operational risk
Approved interfaces and governed workflows protect continuity and accountability.
A continuous operational intelligence layer
Existing systems contribute to one governed model for analysis, simulation and decision support.
Utility data
Smart meters
BMS
Weather
Solar
Storage
ENERGE TWIN
Analytics
Decision support
Operational capabilities that work together
The model combines monitoring, simulation, optimisation, carbon and maintenance intelligence within one governed operating context.
Real-time energy monitoring
Translate live evidence into prioritised actions while retaining operational constraints and confidence.
Predictive simulations
Translate live evidence into prioritised actions while retaining operational constraints and confidence.
HVAC optimisation
Translate live evidence into prioritised actions while retaining operational constraints and confidence.
Renewable energy management
Translate live evidence into prioritised actions while retaining operational constraints and confidence.
Carbon tracking
Translate live evidence into prioritised actions while retaining operational constraints and confidence.
Predictive maintenance
Translate live evidence into prioritised actions while retaining operational constraints and confidence.
Representative simulation
Compare operating choices before implementation.
Values are illustrative model outputs, not guaranteed customer results.
Operating scenarioGuest rooms and central plantConnected asset view
Simulation comparisonBaseline100%Current operating model Modelled84.8%Optimised scenario
See the outcome before making the change
- Energy
- -15.2%
- Cost
- Indicative
- Comfort
- Protected
- Confidence
- High
Operational evidence translated into measurable value.
Illustrative modelled ranges. Actual outcomes depend on asset profile, climate, tariffs, schedules, data quality and implementation.
Operational experience
Optimisation guests never have to notice
Arrival
Service conditions remain protected while energy performance improves.
Rooms
Service conditions remain protected while energy performance improves.
Leisure
Service conditions remain protected while energy performance improves.
Comfort
Service conditions remain protected while energy performance improves.
Connected path to net zero
Net-zero operationsEfficiencyRenewablesStorageVerification
From discovery to continuous improvement
Discover
Build evidence, test decisions and verify progress.
Connect
Build evidence, test decisions and verify progress.
Model
Build evidence, test decisions and verify progress.
Analyse
Build evidence, test decisions and verify progress.
Simulate
Build evidence, test decisions and verify progress.
Optimise
Build evidence, test decisions and verify progress.
What made the operating case credible
Every result communicates where the evidence came from and how it should be interpreted.
Meters, BMS and verified records
Weather, schedules and occupancy context
Scenario assumptions remain visible
Outcomes compared with the governed baseline
Operational safeguards
- Comfort and service requirements remain explicit
- Approved scenarios retain accountable owners
- Measured outcomes update the baseline
Technical basis
- Model
- Operational Digital Twin
- Evidence
- Measured, derived and modelled
- Control
- Governed implementation
Intelligence that supports the next decision
Real-time monitoring
Surface drift and anomalies while action can still protect performance.
Scenario simulation
Compare operational choices, assumptions and likely outcomes.
Sustainable performance
Connect efficiency, renewables, carbon and service requirements.